Creating a Comfort Benchmark at Tulane
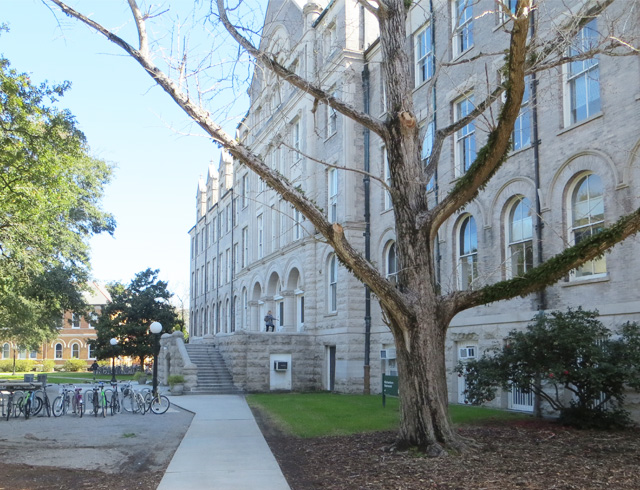
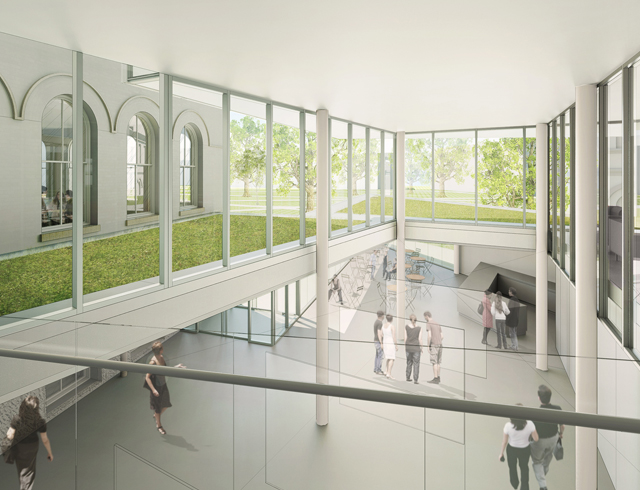
Richardson Memorial Hall, Tulane University's School of Architecture, is in the design development phase of a renovation and addition.
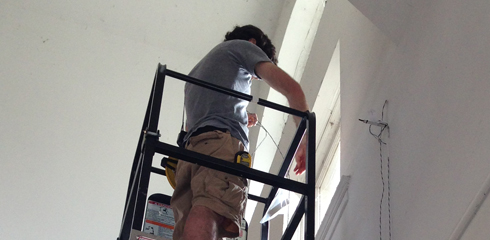
Last winter, KieranTimberlake team members installed 150 temperature sensors at Richardson Memorial Hall, Tulane University's School of Architecture. Over the summer, the sensor platform was reactivated and augmented with the addition of relative humidity sensors. We initiated the summer monitoring to answer two primary questions: How comfortable is a historic building on Tulane's campus in the thick of the summer cooling season? And, can monitoring be used to reveal deficiencies in the existing envelope and HVAC system?
The summer monitoring results were quite striking when contrasted to the winter results. During the winter, significant temperature stratification and asymmetries in mean radiant temperature (MRT) were found within the building, while in the summer, data pointed to conditions that were both comfortable and consistent.
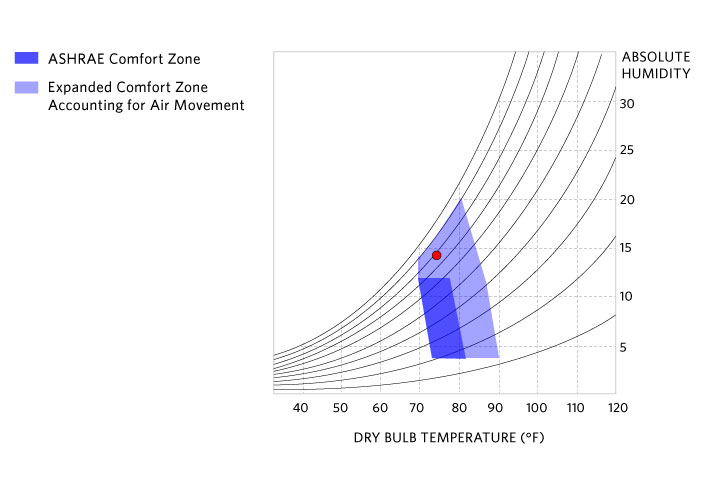
A psychrometric chart generated from monitoring data in a fourth-floor studio. This chart shows the ASHRAE comfort zone as well as an expanded comfort zone that accounts for air movement in the space. The red dot reflects the time stamp corresponding to concurrent mean radiant temperature mapping within the Grasshopper data parsing interface.
Ambient air temperature readings taken during the summer in the center of the fourth floor studio show a very small spread, ranging from a low of 72°F to a high of 76°F—quite pleasant compared to the sultry weather outside on the New Orleans campus. When plotted in a psychrometric chart alongside relative humidity measurements taken at the same location, it was apparent the dry bulb temperature readings fell within the comfort band. However, the concurrent relative humidity readings exceeded the ASHRAE comfort zone, defined by the small parallelogram in the psychrometric chart above. Once the comfort zone was expanded to reflect the sensible benefits of natural ventilation and air movement (shown by the larger shape), the revised comfort zone encompassed the entire data set. Given the high air velocity inherent in the existing forced air system, the expanded comfort zone is likely reflective of the actual circumstances in the studio space, a conclusion confirmed by on-site observations.
Along with trending-toward-comfortable temperatures, the analysis of MRT in the space showed a high level of thermal symmetry during the summer. Aside from a modest increase in MRT in the morning due to solar exposure on the glazing of the eastern facades, the analysis showed the existing supply air distribution system to be capable of ensuring that room temperatures fell within the comfort band at nearly all times. This suggests that supplying air laterally from the top of the vaulted ceiling is an effective means of achieving uniform temperature distribution during the cooling season. However, the remarkable consistency of the data points to the mechanical system running continuously, without setbacks for nighttime/unoccupied conditions, offering little opportunity for energy savings.
Though we are still in the process of analyzing heating and cooling performance, this summer monitoring effort allowed us to understand the comfort level at Richardson Memorial Hall as relatively good during the hottest part of the summer season and to establish a comfort benchmark for that time period. Any changes to the mechanical systems during the renovation will likely be directed at achieving higher-level performance with regard to energy savings across all seasons. Our ultimate goal is to generate a design that responds accurately to the thermal context of the existing building and ensures the highest level of comfort with the least amount of energy.